If you earn money online, your numbers are scattered — AdSense in one tab, AdMob in another, YouTube somewhere else. Aperio pulls all of it into a single live view on your phone, so you can stop exporting CSVs and start actually reading your business.
Here's exactly what Aperio connects to, and every metric you can put front and centre on your dashboard.
The platforms Aperio connects to
You connect each source independently — ad platforms use a secure Google sign-in; RevenueCat uses a read-only API key. Either way, Aperio reads through the platform's official API and never changes anything in your account. You can even connect Google accounts that live under different logins, which is handy if your AdSense and AdMob sit in separate accounts.
Google AdSense — your website and display earnings: estimated revenue, impressions, clicks, and the rates behind them. If you run content sites or blogs, this is usually your anchor number.
Google AdMob — your in-app ad revenue, broken down the same way. For indie developers and studios, AdMob is often where the day-to-day movement happens.
YouTube — your channel's ad earnings and performance, sitting right next to everything else instead of buried in a separate Studio tab.
RevenueCat — your subscription MRR, active subscribers, and trials, on the same dashboard as your ad income. For app developers who monetise with both ads and in-app purchases, this is where the full picture finally comes together.
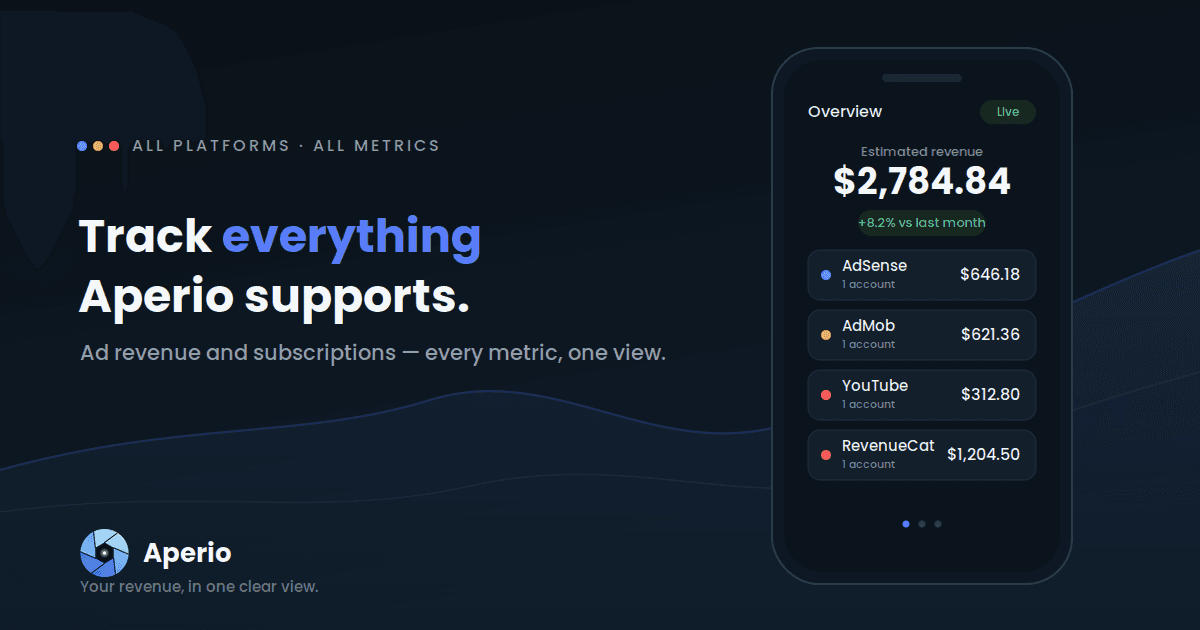
Each platform appears as its own card on the overview, and they roll up into one combined estimate at the top — so you get both the headline figure and the per-source breakdown in a single glance. More platforms are on the roadmap, and because every connection is independent, adding one later won't disturb what you've already set up.
See it in one place. Download Aperio and connect your first platform in under a minute.
The KPIs Aperio tracks
Aperio isn't locked to a single metric. From the dashboard you pick which KPI leads — tap the metric selector and your charts, comparisons, and per-platform cards all re-orient around it. Here's the full set you can choose from:
| KPI | What it measures | Unit |
|---|---|---|
| Estimated Revenue | Your total estimated earnings across all connected platforms for the selected period | $ |
| Total Clicks | How many times your ads were clicked | # |
| Total Views | How many times your content or ads were viewed | # |
| Ad Impressions | How many ads were served | # |
| Ad Impressions RPM | Revenue per 1,000 impressions — how much each thousand ad views is worth | $ |
| Ad Impressions CTR | Click-through rate — the share of impressions that turned into clicks | % |
| Ad Clicks CPC | The average value of a single ad click | $ |
| Estimated MRR | Your monthly recurring revenue, if you also earn from subscriptions | $ |
| Active Subscriptions | How many paying subscribers you have right now | # |
| Active Trials | How many users are currently in a free trial | # |
It helps to read these in four groups:
The money metrics
Estimated Revenue and Estimated MRR answer "how much am I making?" Revenue is your ad and content earnings for the period; MRR is the recurring subscription side, for anyone running a paid plan alongside ads.
The efficiency metrics
RPM, CTR, and CPC answer "how well is it working?" Two sites can earn the same revenue with very different RPMs; watching the rate, not just the total, is how you spot a page or placement that's quietly underperforming. CTR tells you how compelling your ads are to viewers, and CPC tells you what each of those clicks is actually worth.
The volume metrics
Total Views, Total Clicks, and Ad Impressions answer "how much traffic is moving through?" They're the denominators behind your rates, and a sudden swing in impressions is often the first sign something changed upstream.
The subscription metrics
Active Subscriptions and Active Trials matter if your revenue isn't only ads. Trials are a leading indicator: a healthy trial count today is next month's MRR.
How the metrics come together
Picking a KPI is only the start. On the dashboard you can:
- Compare periods — this month versus last, this week versus the same week prior — so every number arrives with context instead of floating on its own.
- Filter by asset — view everything together, or drill into a single site, app, or channel.
- Set a goal — give yourself a monthly revenue target and watch your progress fill toward it.
- Choose your currency — see your earnings in the currency you actually think in.
- Stay current automatically — your data refreshes in the background, so you open the app to numbers that are already up to date rather than waiting on a manual reload.
That's the whole point of one dashboard: not just seeing the metrics, but seeing them next to each other, over time, against a goal.